Metrics
This section represents the Dashboard of the Quality Characteristics.
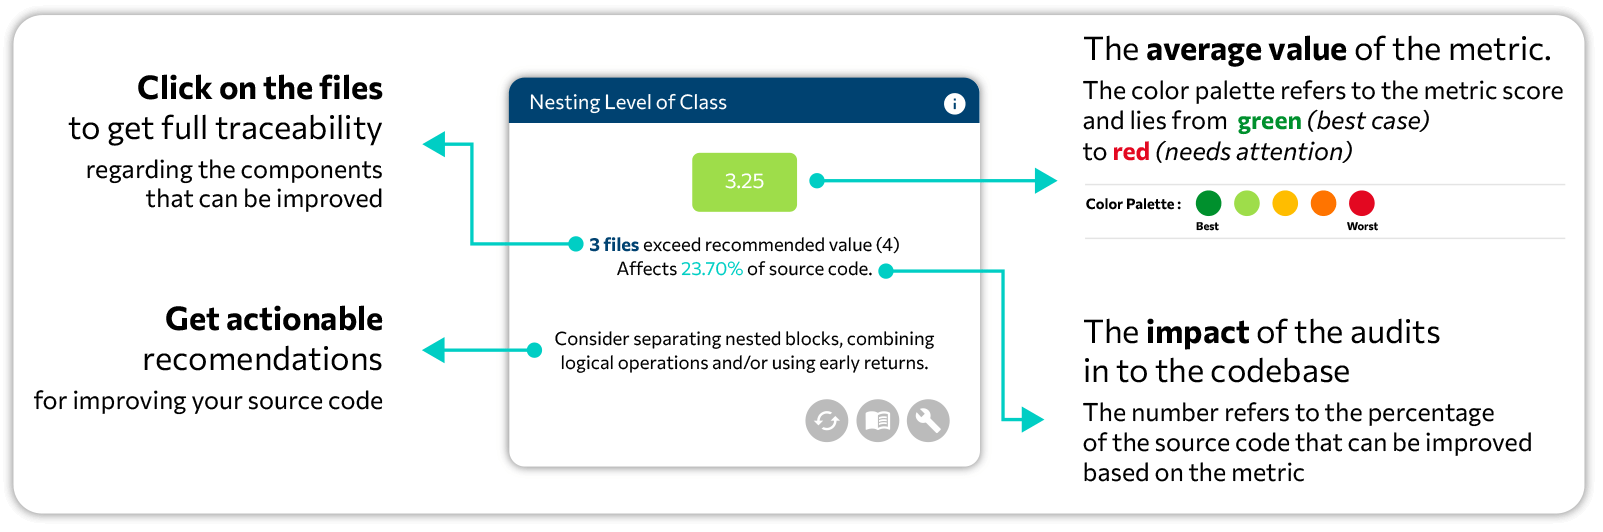
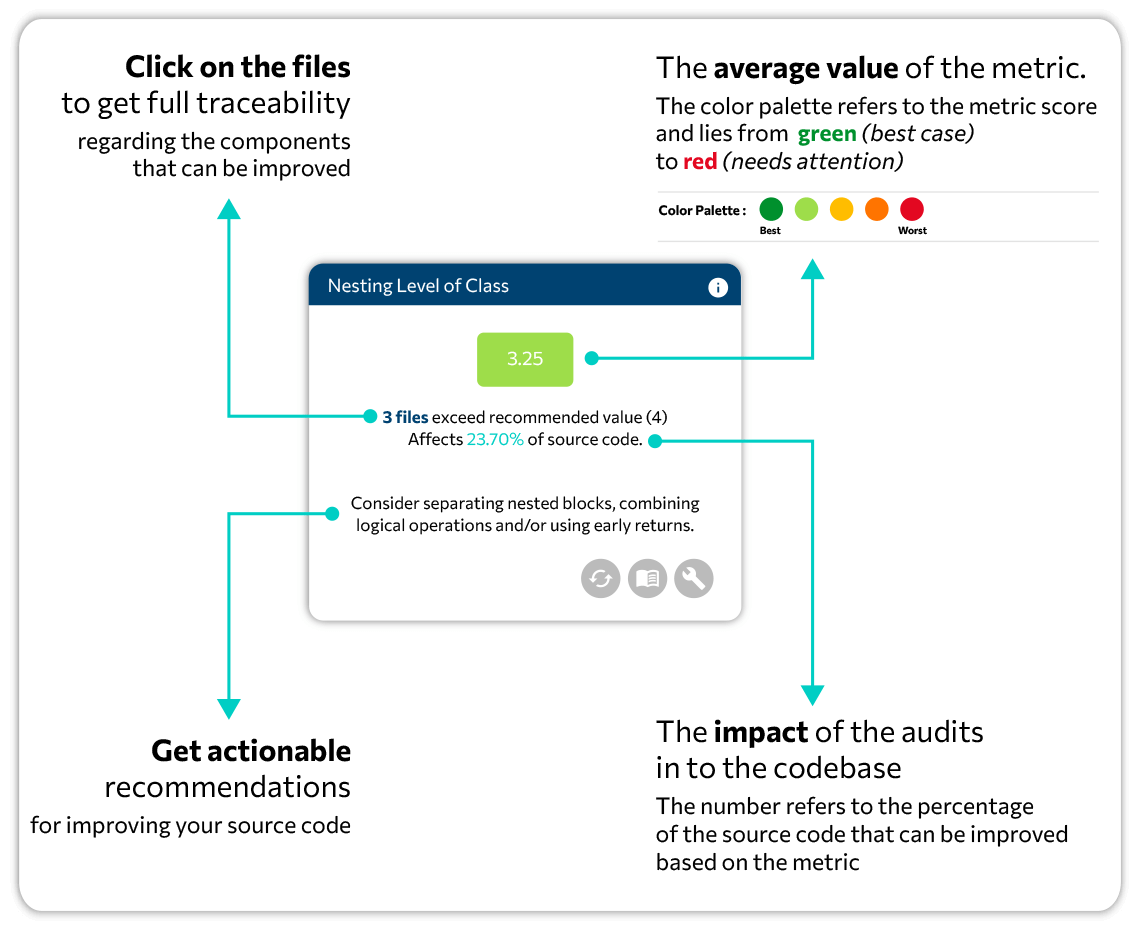
For each branch and for each Metric Category you can get an analytical list of the metrics that are calculated every time a new analysis takes place in your software.
Cyclopt provides a data driven analysis, the results of which are displayed in color codes. Also, the number of the files and the percentage of the source code affected is indicated. Last but not least, Cyclopt suggests a fix that will optimize the metric.