Usage
Usage
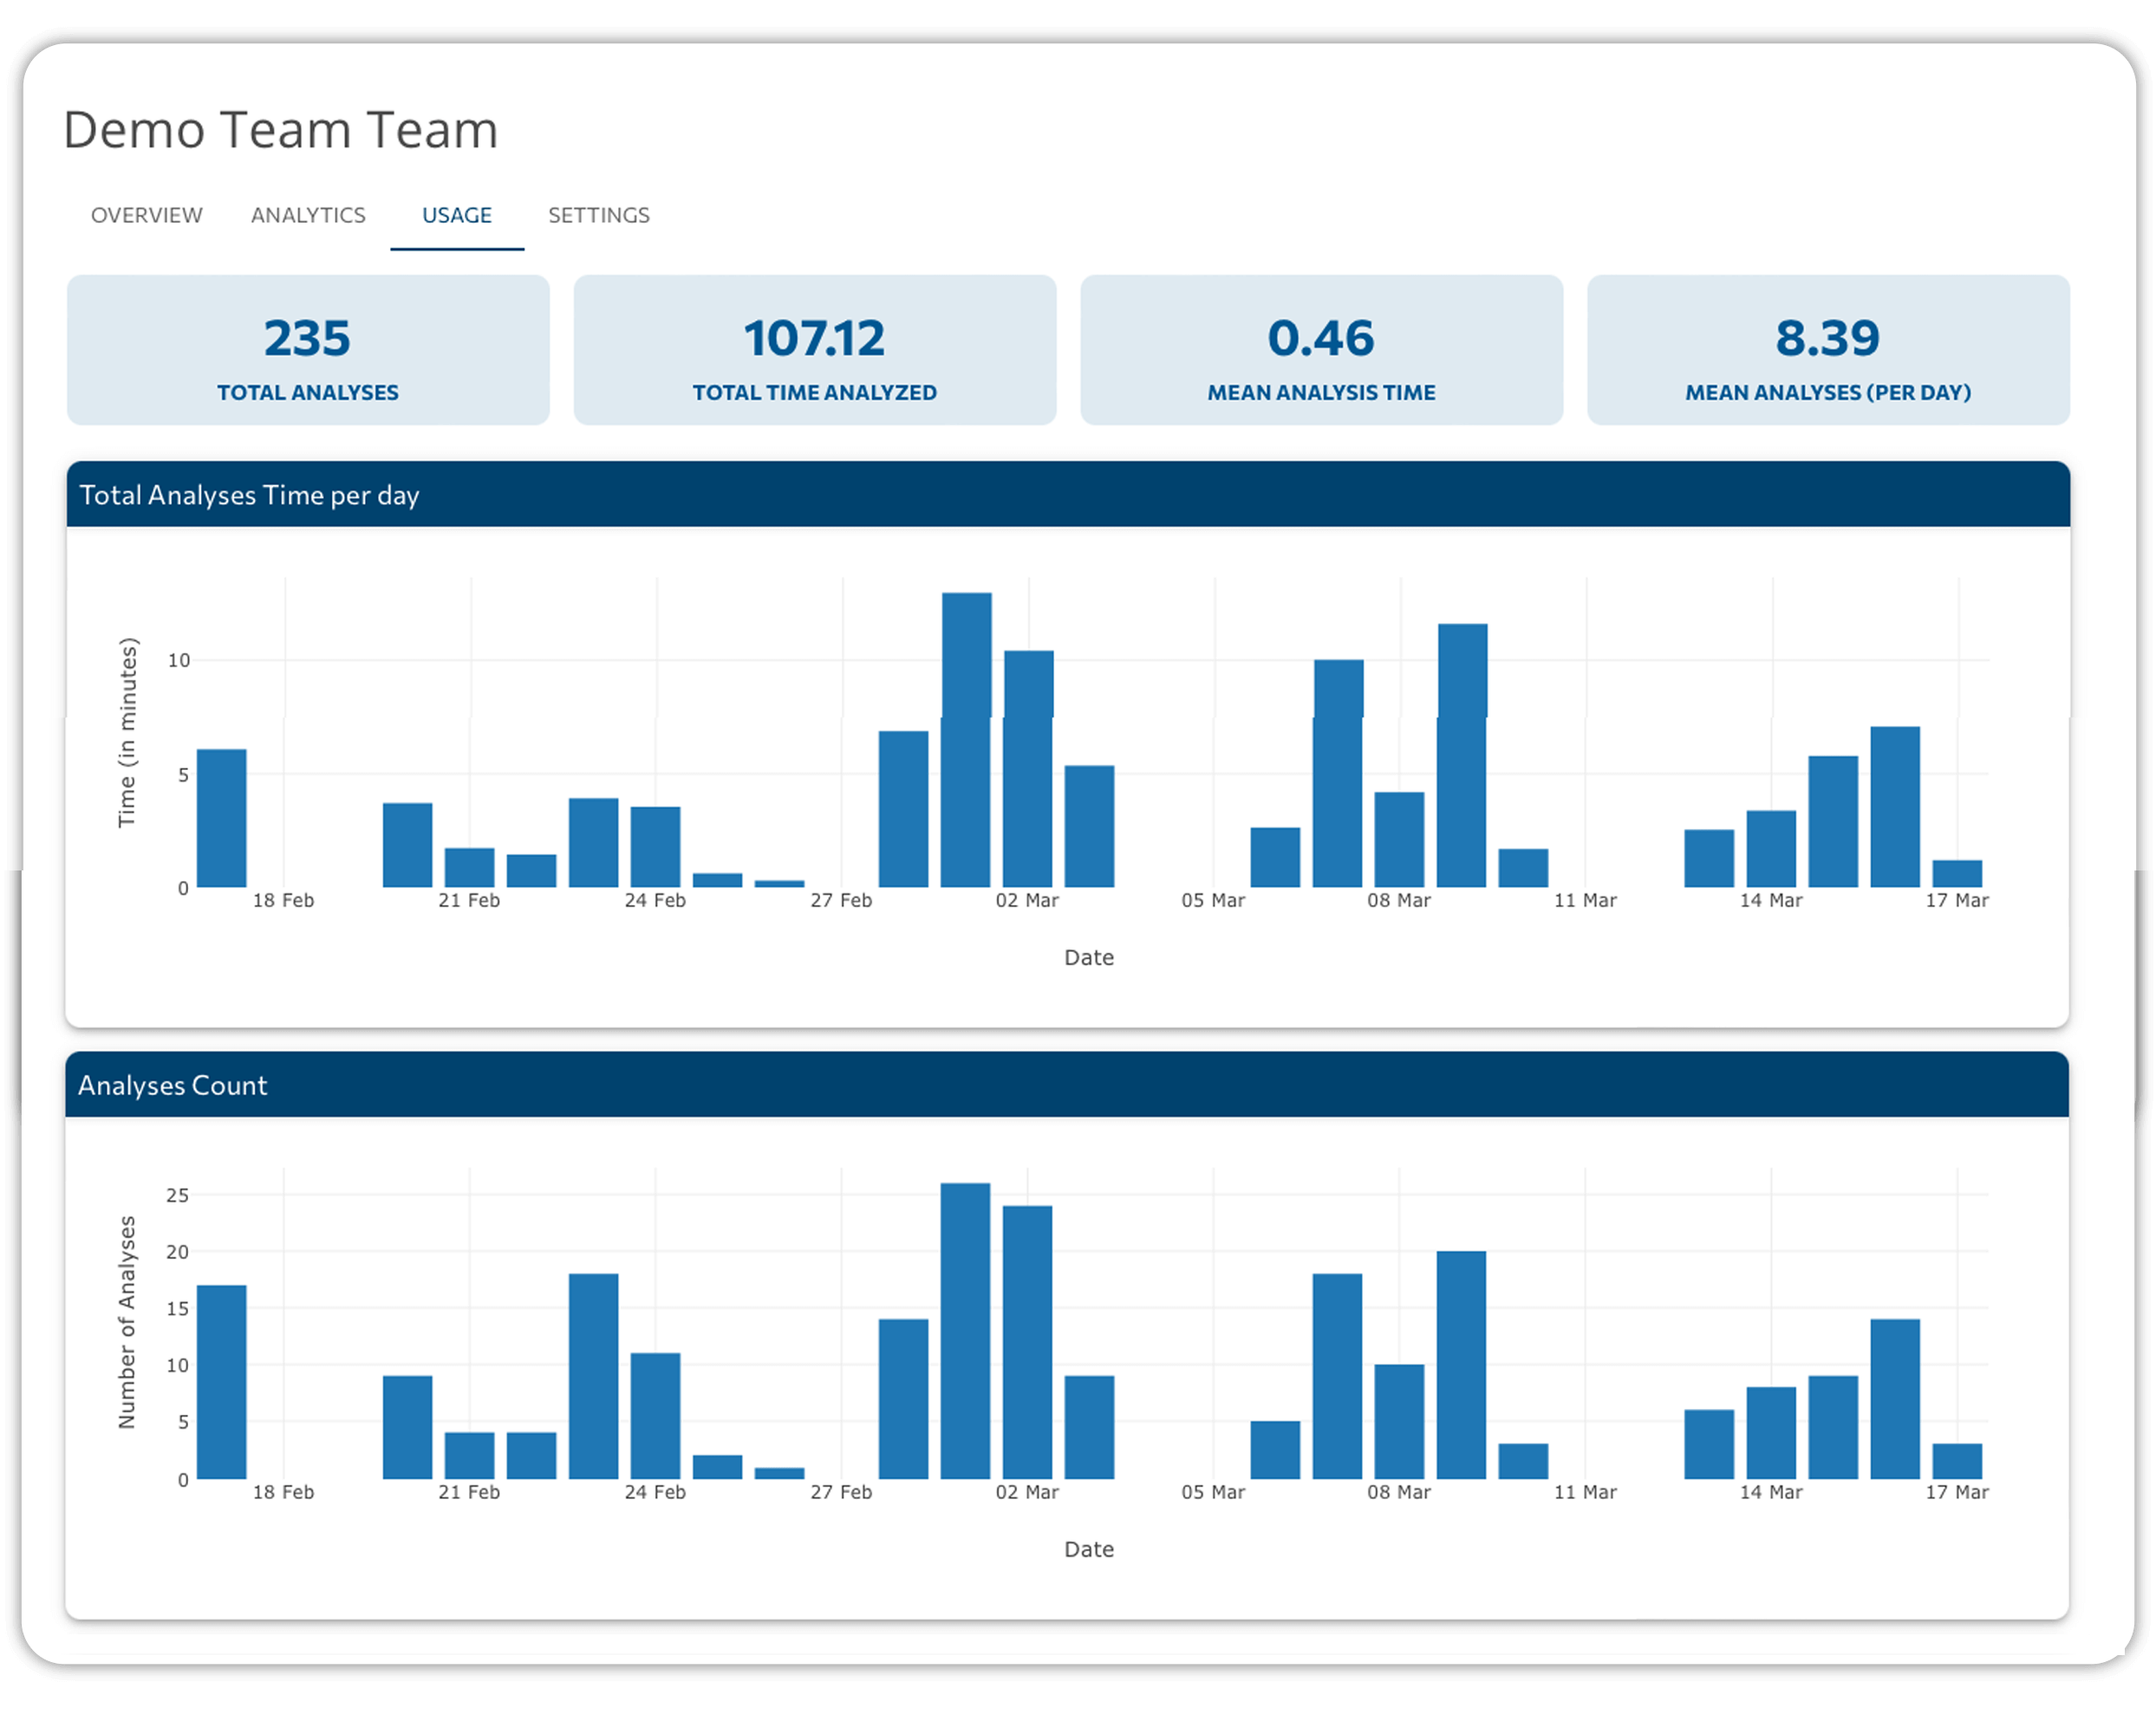
This screen illustrates the platform usage of your team. You can see some overall graphs for Total Analyses Time and Total Analyses Count per day.
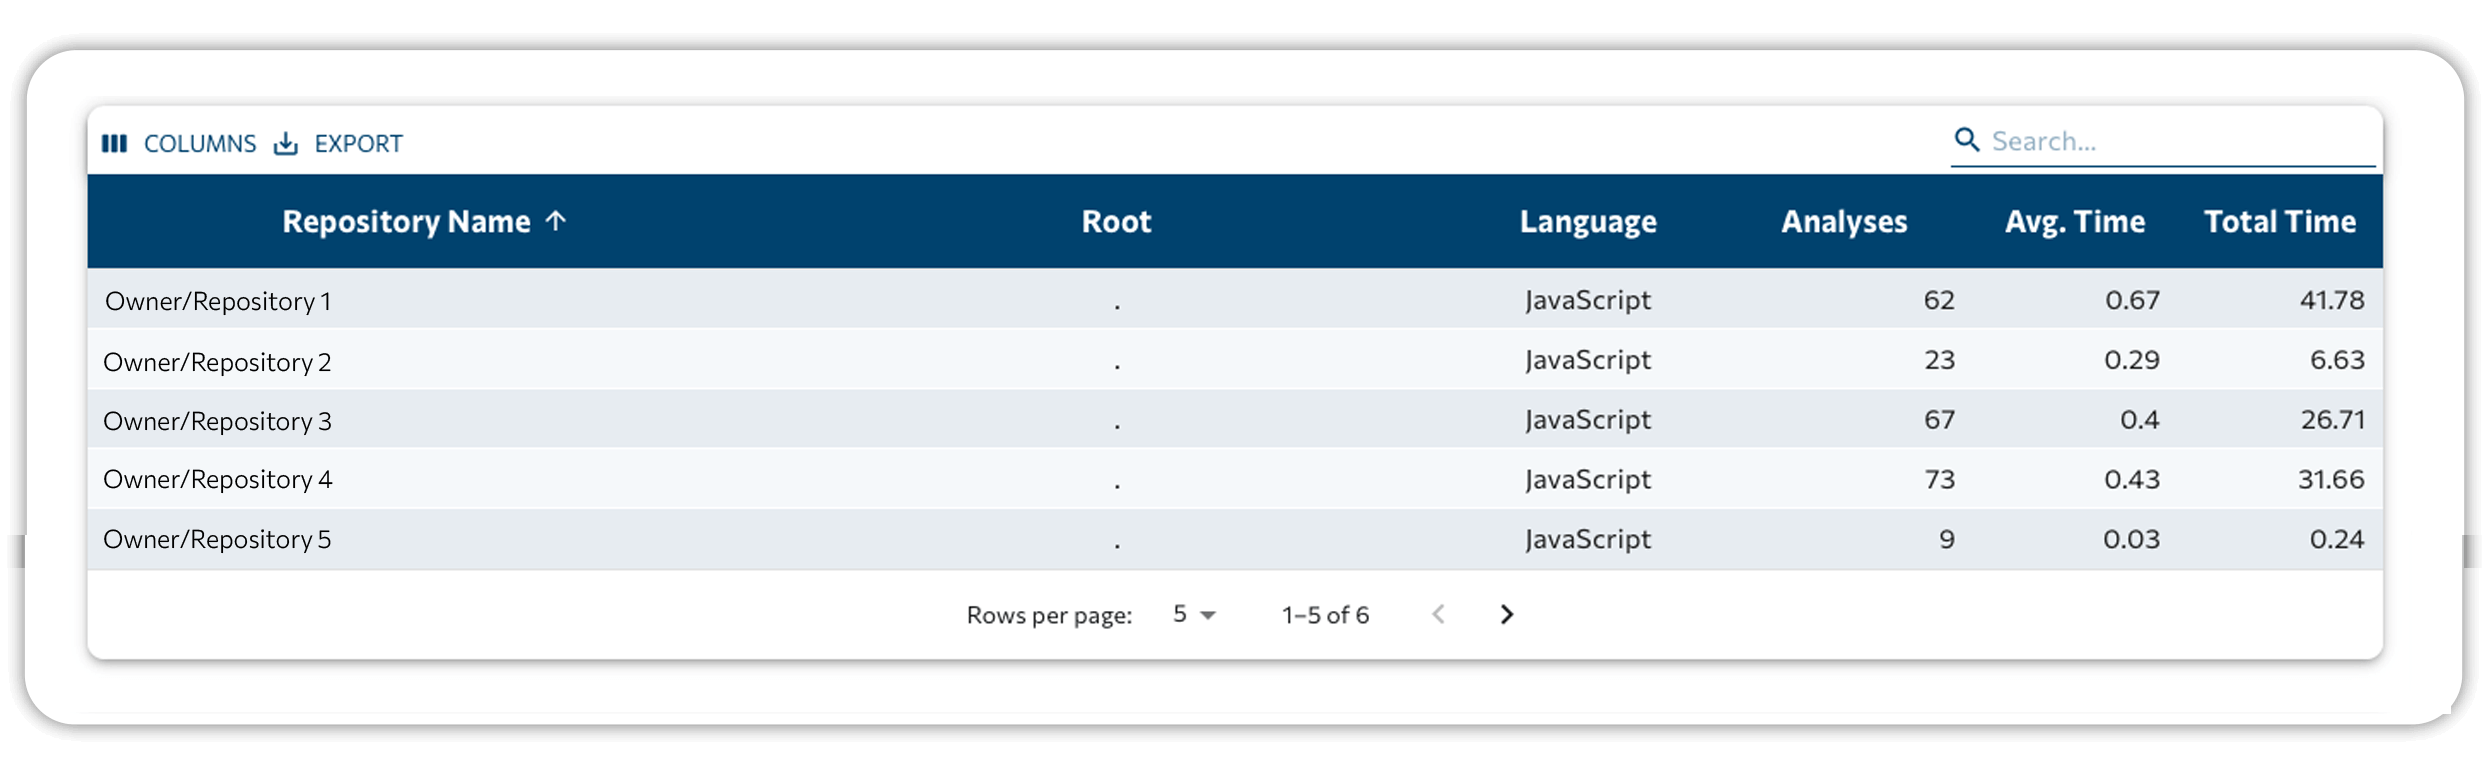
You can also get information about your repositories. For each repository you can see the Root, Language, Total Analyses, Average time Per Analyses and Total Time Analysis